
Analysis
How to Optimize Media Investments in the Dynamic Telecommunications Market with Econometrix
Market Landscape: Asymmetry in Market Share, Loyalty, and Perception
The telecommunications services market in Slovenia is highly competitive and saturated. Providers compete for the same customers across bundled services (internet, mobile telephony, and TV). The market leader (Brand A) holds a 56% market share, followed by Brand B (37%) and Brand C (36%), while Brand D serves 20% of users (due to overlapping services, the combined shares exceed 100%).
Interestingly, a high market share does not automatically translate into the highest customer loyalty or strongest brand perception:
Brand A (Market Leader): Records excellent brand perception (+41% above average) and modest 2% growth, but significantly overspends to maintain its advertising position.
Brand B: Despite its high market share and customer loyalty, it is experiencing a rapid 10% decline in users and has low brand perception (-11% below average).
Brand C: Invests moderately, has above-average brand perception, and is achieving strong 8% user growth.
Brand D: Significantly underinvests in advertising and is experiencing a 7% decline in users.
1. Determining the Right Budget Level: Identifying Overspending and Underspending
Econometric analysis using Econometrix reveals a key insight: most operators miscalculate the appropriate level of their investments.
We defined a common strategic objective for the providers: 5% growth in the number of users over the coming year. Calculations based on the SOV/SOM ratio, the perception index (using Perceptix), and the target growth rate reveal some stark findings:
Brand A (Market Leader) generates a 47% overspend. Its media investment is significantly above the saturation point. Reducing the budget would not harm its growth but would simply free up capital.
Brand B suffers from underinvestment. To reverse the decline and achieve 5% growth, it needs to increase its budget by 12%.
Brand D is critically underspending. To reverse the negative trend, it would need to increase its investment by as much as 62%.
For Brand C, we estimate that its previous budget is appropriate for the coming period and sufficient to support the planned growth.
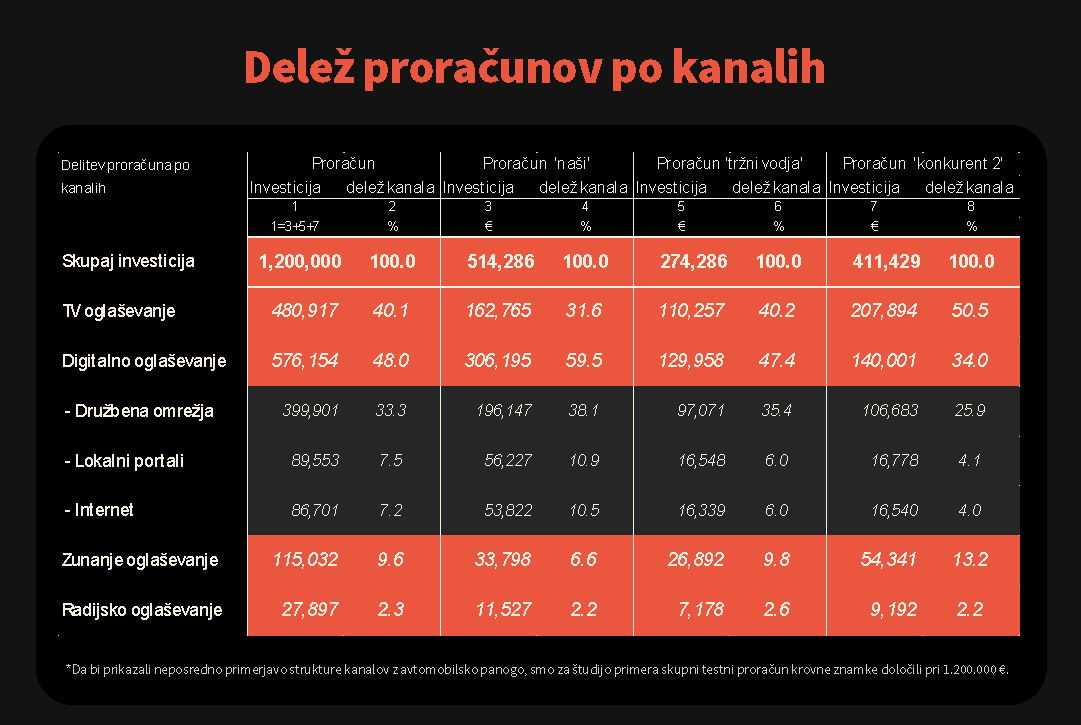
Note for this case study: To enable a direct comparison of the channel mix with the automotive industry, we set the total test budget for the overall brand at €1,200,000.
2. Data-Driven Definition of Target Audiences and Strategic Priorities
In telecommunications, the campaign focuses on the overall brand and acquiring users from competitors. By analyzing subscriber churn, we defined three key target audiences:
Current users of the brand (Priority 1): Key to protecting the subscriber base and preventing churn.
Users of the market leader (Priority 2): The largest pool for acquiring new subscribers.
Users of the third major competitor (Priority 3): A secondary pool for growth.
Methodologically, we assigned each group its strategic weight and exposure duration and calculated its specific media profile.
3. Budget Allocation by Channel: Telecommunications vs. Automotive
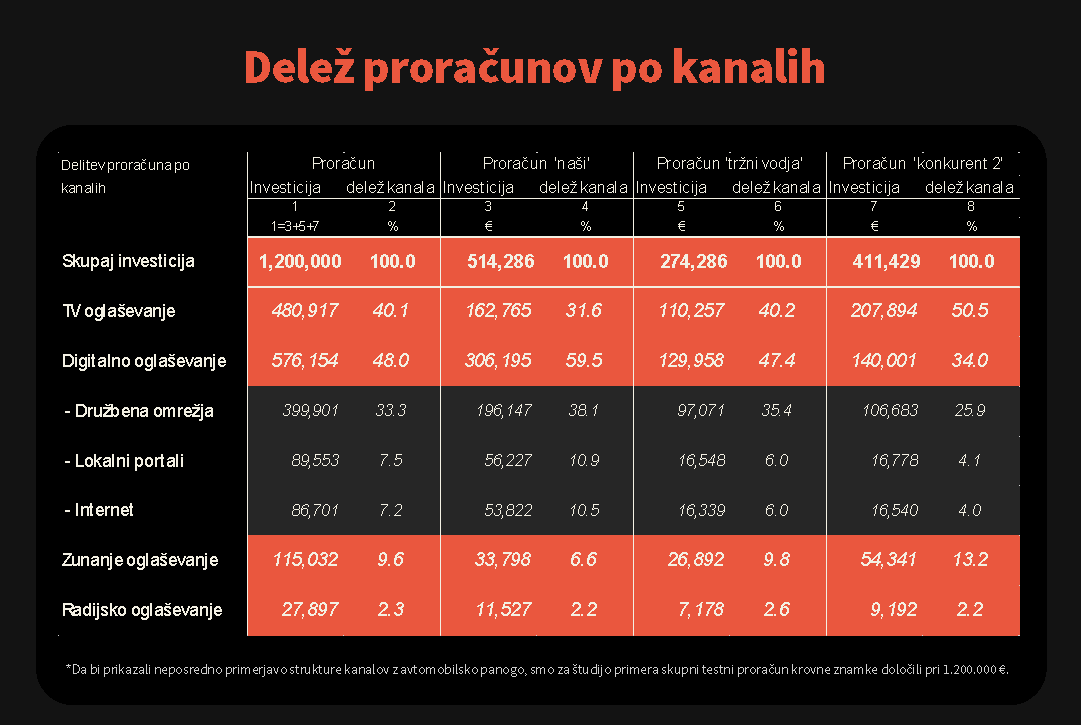
Because telecommunications users have completely different media consumption patterns from car buyers, Econometrix calculates an entirely different distribution of media investments.
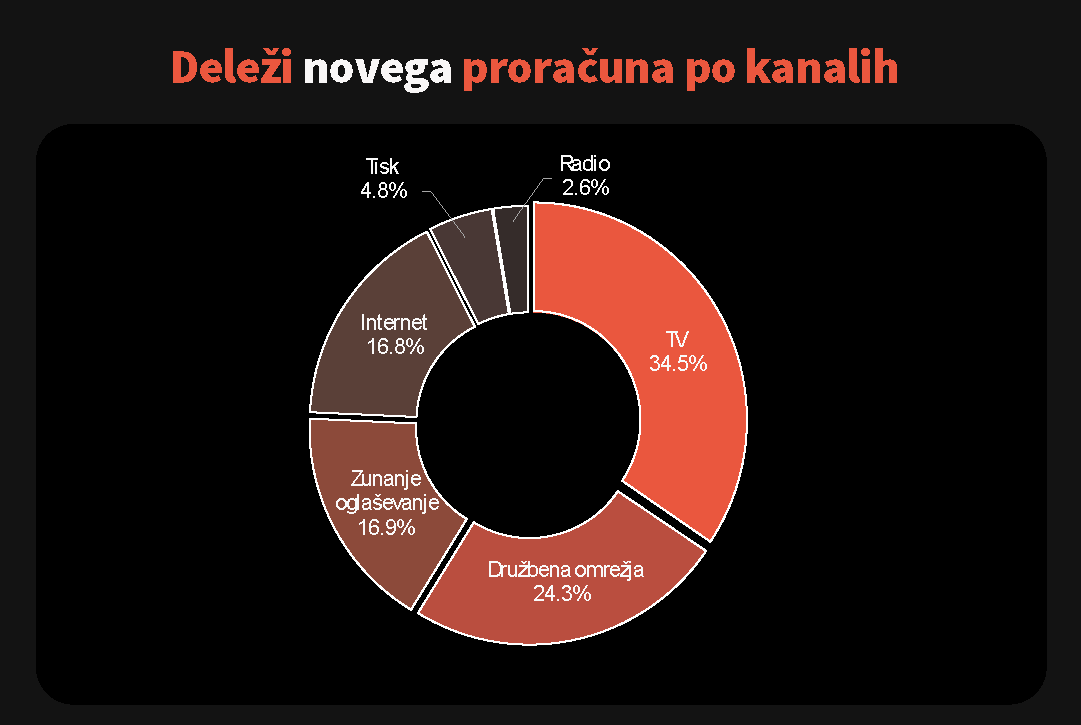
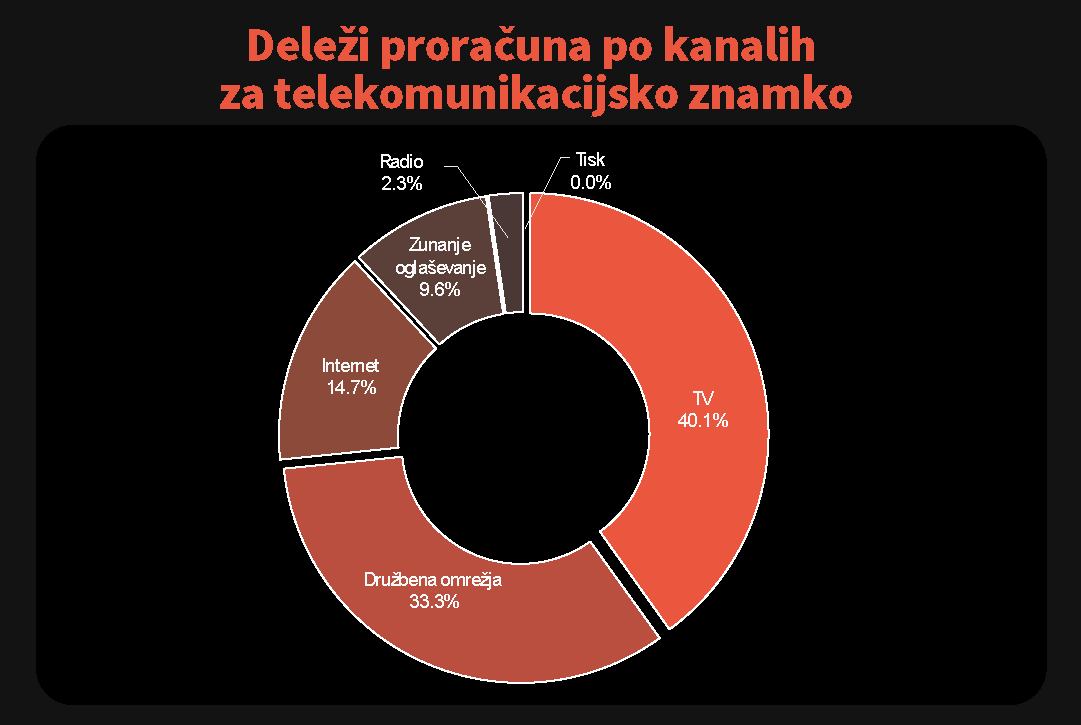
The analysis is based on the historical investments of the largest competitors, adjusted for projected media consumption trends:
Different media profiles within the same category: Competitor 2’s users are highly TV-oriented, with television advertising requiring as much as 50.5% of the budget. In contrast, our existing users are significantly more digitally oriented, so only 31.6% of the budget is allocated to TV, while as much as 38% is allocated to social media (compared with only 26% for Competitor 2).
This demonstrates that blindly copying competitors’ media mix or relying on industry averages is the fastest route to unmeasurable spending.
4. Fine-Tuning by Media Companies and TV Channels
Once Econometrix defines the framework by channel, the next step is selecting specific media companies. The selection criterion is not the lowest cost per point or click, but rather a combination of high reach and above-average purchase affinity among the target audience.
Example: Optimizing TV Channels
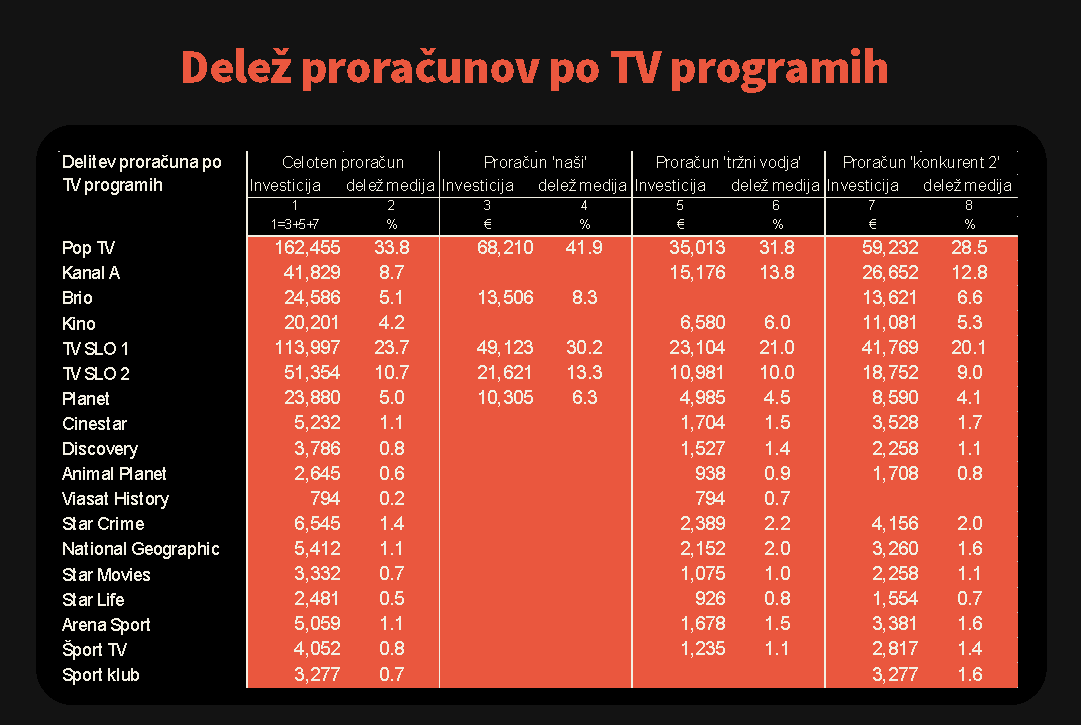
For our users: The data shows that a concentrated selection of just 5 TV channels is sufficient to achieve optimal reach and affinity.
For Competitor 2’s users: Due to their more fragmented viewing habits, the model recommends a broader mix across 17 TV channels.
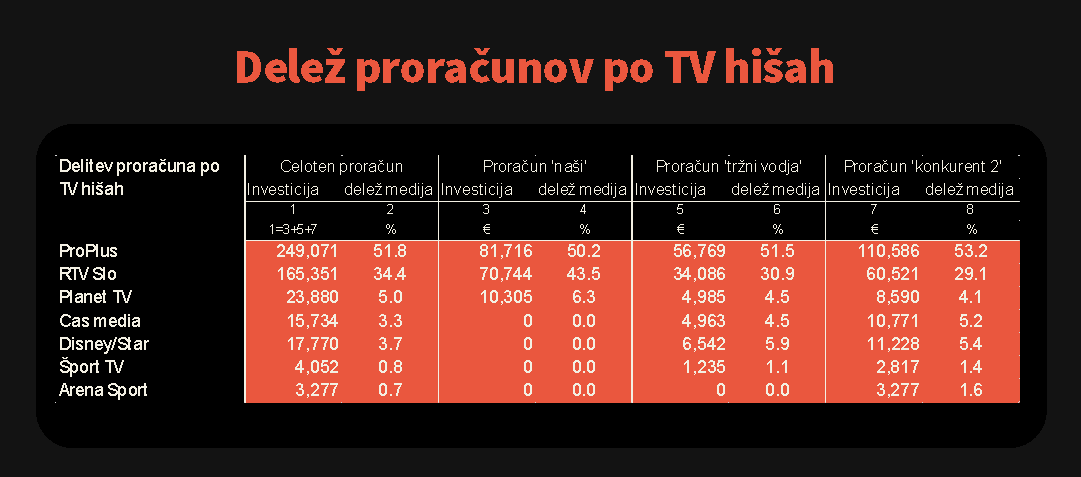
Strategic note for procurement and marketing: Media companies often offer “packages” (e.g. Disney or Cas Media) with a standard allocation across all of their channels. Econometrix provides procurement teams with robust data they can use to negotiate the purchase of only those channels and programming content that have a proven high affinity among your customers.
Example: Social Media Optimization
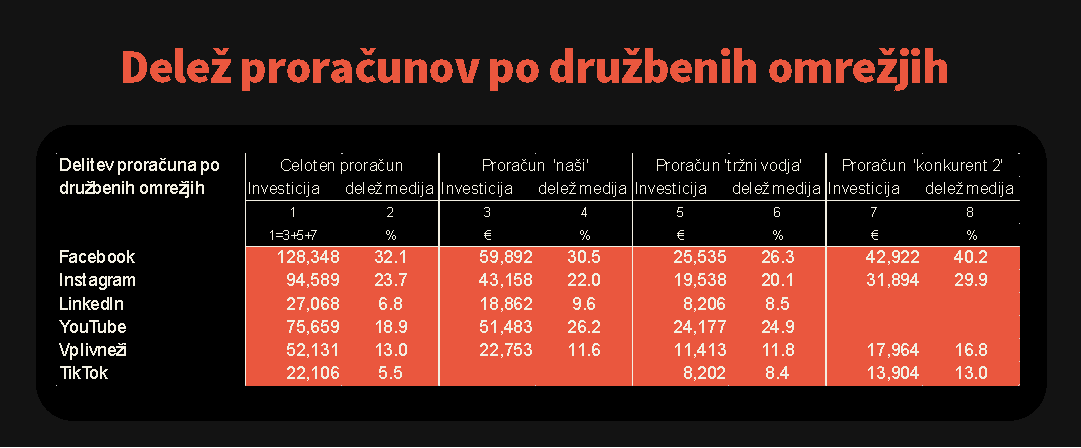
The optimization also clearly reveals differences between individual platforms (Meta, TikTok, LinkedIn, and YouTube). Our users show a high affinity for social media (38% of the budget), while for Competitor 2 this share is significantly lower (26%), with a different allocation across individual platforms.
Conclusion: Data-Driven Decisions You Can Always Justify
Econometrix does not replace your media agency when it comes to the operational execution of media buying.
Econometrix gives you data-driven power and strategic authority. Instead of accepting agency proposals “on trust” or making decisions based on incomparable offers, the Econometrix platform gives you clear answers:
You know exactly where the saturation point lies and where you are overspending.
You can clearly justify why certain media channels were prioritized over others (high affinity and reach).
You can justify every euro invested to management and finance at any time using a mathematical model.
Contact us for a presentation of the model using your own data at https://econometrix.app/en